Great news – we’re cutting the cost of TeamCity Pipelines! Now, the prices start from USD 15/month. Check out all the pricing options on our website.
Why the change? Because we’re committed to making modern, reliable CI/CD solutions affordable for teams of all sizes. Building and shipping great software shouldn’t break the bank.
New UI
With this release, we’ve given TeamCity Pipelines a fresh look! The main menu has moved to the left-hand side of the interface, making it easier to navigate and keeping all the important stuff right at your fingertips.
Bug fixes and improvements
We’ve also fixed some bugs to make your TeamCity Pipelines experience smoother. Here’s what’s new:
There’s no longer an issue with pipelines appearing empty when clicking the Edit button.
Smooth parameters are working as intended for custom JDK paths or Dockerfile paths. You can now define these fields using parameters seamlessly – no more manual adjustments needed!
The Maven runner now allows you to specify a custom path for Maven installation in pipeline jobs.
That’s it! If you have any questions or comments, feel free to leave them in the comments section below. We’re always happy to hear your feedback.
TeamCity 2024.12 introduces a redesigned UI, conditional build chains, simplified OAuth token management, and enhanced AWS and Perforce integrations.
New features also include support for custom Kotlin DSL libraries, centralized refreshable token management, and single-action build chain approvals, among others.
Conditional dependencies in build chains
In TeamCity, you can break down complex build processes into distinct stages, each executed on different build agents. These interconnected stages form what we call a build chain. A build chain is configured by creating multiple build configurations, each representing a stage, and linking them with snapshot dependencies.
Until now, every part of a build chain was expected to run or be reused from a previous run.
With TeamCity 2024.12, we’re introducing conditional dependency execution, which lets you selectively skip certain stages when a build chain is queued.
For example, imagine you’re running a large test suite where each build configuration represents a specific set of tests, like frontend tests, backend tests, and performance tests.
With conditional dependencies, you can configure your build chain to run specific builds depending on files in the VCS commit. There is no need to run your backend or performance tests if only CSS files were changed, but you still need the final deployment package at the end of your build chain.
Previously, TeamCity allowed skipping particular steps of a single build configuration. Now, whole builds can be skipped, and they won’t occupy a build agent at all.
This update enables you to create more efficient, targeted build chains by omitting specific configurations as needed.
Read more about how to configure the functionality in our release notes.
[Experimental] Kubernetes executor mode
TeamCity already offers a native integration with Kubernetes, but with 2024.12, we’re extending this functionality. Now, TeamCity can directly use Kubernetes as a scheduling and orchestrating system for your builds, thanks to the experimental Kubernetes executor mode.
Now, you can specify the task you want to run and which image you want to run it on, and Kubernetes will do everything else.
Key benefits of the integration include:
Native Kubernetes integration: Developers and QA teams can configure their builds without diving into infrastructure details like servers or cloud providers. Meanwhile, infrastructure teams can focus on preparing familiar Kubernetes setups. TeamCity builds are executed on native K8s pods, with each step running inside its own container. This allows you to use separate Docker images for each individual build step, among other advantages.
Faster task execution: Builds start much more quickly compared to virtual servers, enabling developers to get feedback from automated tests sooner.
Efficient resource utilization: Kubernetes allows multiple builds to run on a single server, compactly placing workloads and maximizing resource use. With less idle time, resources are utilized more effectively. This functionality is now available in TeamCity out of the box.
Read more about the experimental Kubernetes executor mode in our docs.
UI updates: Breadcrumbs and redesigned navigation
With TeamCity 2024.12, we started updating TeamCity’s product design. The main menu now resides on the left-hand side of the screen, offering a more intuitive structure that keeps key actions and views within reach.
Breadcrumbs at the top make it simple to track your location within complex builds or pipelines so you can quickly move between projects and configurations.
This update enhances accessibility and brings a cleaner, more organized workspace that feels natural whether you’re working on a single project or managing multiple builds.
Simplified VCS OAuth token management
In TeamCity 2024.12, we’ve implemented the Project Administration tab for managing short-lived VCS OAuth tokens. This initial rollout provides essential tools to streamline token handling in the admin UI.
Our goal is to make OAuth-like tokens more accessible, enabling project administrators to view, configure, and create custom tokens with ease.
Key capabilities include:
Token search and display: Easily search for and view tokens available to specific TeamCity projects.
Token deletion: Remove outdated or unused tokens with a single click.
Token details: Inspect and copy token IDs for streamlined integration, especially for Kotlin DSL usage.
Token naming: Assign descriptive names to tokens for easier identification and organization.
Token scope: TeamCity displays a list of projects where the token can be used.
OAuth authentication flow: Trigger OAuth flows directly to generate and securely store new tokens.
This update also extends token functionality in VCS roots, build features, and project settings, making token management more accessible across the TeamCity interface.
Approve an entire build chain
In complex release workflows, a build chain might consist of many individual dependencies, which often require approval from a release manager.
Previously, triggering the composite configuration resulted in all dependent configurations needing separate approvals.
In 2024.12, we’re introducing the ability to approve an entire build chain in a single action. Release managers can now approve a composite build and its downstream dependencies without needing to authorize each individual configuration. This makes the release process more efficient.
Pull request filters
TeamCity 2024.12 supports pull request filters in branch filters using the +|-pr: syntax. This lets you create detailed filters to track pull requests based on factors like author, user role, target and source branches, and more.
Currently, this new syntax is available only for triggers. To set it up, click the magic wand icon next to the Branch Filter field in the trigger settings to open an expression editor.
Perforce integration enhancements
With the latest update, when a Perforce VCS root is set to check sources by label (using the Label/Changelist to Sync setting), TeamCity now records the corresponding revision number in a new vcsRoot.{externalId}.changelist parameter.
This enhancement improves usability by providing clear and immediate identification of the synced revision, streamlining traceability and management.
Custom Kotlin DSL libraries
TeamCity allows you to configure pipelines programmatically using the Kotlin DSL. Starting with version 2024.12, you can upload custom Kotlin libraries as a .jar file to your TeamCity server that will be available to use in your Kotlin DSL projects as a Maven dependency.
This simplifies the sharing and reuse of Kotlin DSL code between different projects.
To learn more about adding custom Kotlin DSL libraries to your TeamCity server, refer to our documentation.
AWS integration enhancements
Amazon EC2 cloud profiles will now use TeamCity AWS connections for authentication, moving away from access keys or the default credential provider chain. This update consolidates authentication settings into one connection, which can be used across multiple features (such as cloud profiles, S3 artifact storage, and AWS credentials).
New EC2 cloud profiles will support these new connections as well as legacy authentication methods, such as keys and default chain providers. Existing connections have received a reworked UI and will continue supporting legacy authentication methods, as well.
In this release, we’ve revamped how build lists and project trees are loaded. Along with frontend optimizations, these changes bring major improvements to performance, especially for users with large TeamCity installations and complex project setups.
For example, some pages now load up to three times faster, based on the 75th percentile data.
If you have any questions, feel free to reach out to us in the comments below or via the support form. We’ll be happy to help!
You can now debug individual jobs in TeamCity Pipelines. Instead of running the entire pipeline, just execute a specific job and get instant feedback without extra waiting.
When you debug a single job, you can:
Review the build log for detailed insights, reducing the need to dig through logs unnecessarily and focus on what’s relevant for that specific job.
Open the agent terminal to easily view system logs on the agent.
Cancel the current running job.
When debugging one job, its dependencies will also be executed. Read more about job debugging in our docs.
Bug fixes and improvements
It’s now easier to spot typos when creating a secret, thanks to the new functionality that allows you to view the secret. Just click on the eye button.
When creating a pipeline from your VCS hosting provider with more than eight repositories, TeamCity Pipelines now clearly tells you that there’s more on the list that’s not shown.
URLs shown on hover are now more visible in light mode.
Did you know?
Getting started with self-hosted agents in TeamCity Pipelines is a breeze! Just copy the ready-made commands straight from the UI – they’re pre-filled with all the right values. Paste them into your terminal, run them, and you’re good to go.
That’s it for now! As always, please let us know if you have any questions.
Virtual Desktop Infrastructure (VDI) has been a popular solution for remote development, but it is not without challenges. At JetBrains, we’ve recently seen growing interest in Cloud Development Environments (CDEs) as an alternative.
To understand why many are thinking about this shift, we contacted our customers and uncovered the key reasons behind the trend. In this blog post, we’ll share what we learned.
TL;DR: VDIs can be helpful for specific use cases, but CDEs are a better choice for software development.
What are VDIs and CDEs?
Virtual Desktop Infrastructure (VDI) is a technology that manages and delivers remote machines, typically virtual ones, to end-users. Users interact with these machines via protocols like RDP, PCoIP, or HDX, which stream the desktop interface to the user’s device. So, technically, VDI uses video streaming to provide a full desktop experience but in a remote environment. This means the remote machine can be used for any purpose, like web browsing, video conferencing, software development, etc.
Companies use solutions like Citrix Virtual Apps and Desktops, VMware Horizon, and others to manage VDI environments (VDIs).
Cloud Development Environments (CDEs) are a newer concept purpose-built for software development. Usually, a CDE is a Docker container or a virtual machine created from a template that specifies the image, repository, environment variables, secrets, and more.
Unlike VDIs, CDEs are designed to be ephemeral, meaning they can be created, used, and destroyed quickly. A developer can create multiple CDEs for different tasks with only the IDE backend running remotely. Communication with the CDE happens via a local client over an efficient JetBrains Remote Development Protocol (in the case of JetBrains IDEs) developed specifically for that case. It makes mouse movement, typing, and the overall experience with the code editor much more pleasant.
To manage CDEs, you need a CDE orchestration solution like JetBrains CodeCanvas.
Why companies use VDIs and why they’re looking to switch to CDEs
During our interviews, we identified the most significant reasons companies use VDIs and why they
aren’t always the best choice for software development. We won’t discuss all the pros and cons of VDIs and CDEs, but we’ll focus on the most common pain points.
1. Security
Security is, without question, the primary motivator for companies to adopt VDIs. While other factors are often cited as benefits of remote development, they are rarely the primary drivers. VDIs provide an out-of-the-box solution for high security requirements.
However, while CDEs require more effort to set up (e.g. integrating with third-party tools), they offer more flexibility and cloud-native security features.
Centralized access control: VDIs provide centralized, user-level access control. Typically integrated with systems like Active Directory, user accounts are managed centrally, and their permissions define what resources they can access on their assigned VDI machines. For example, if a user has the necessary credentials to clone a repository, they can do so directly from their VDI environment. The VDI serves as a general-purpose entry point to the organization’s infrastructure – the fact that a user creates a VDI machine doesn’t mean they have started working on a specific project.
Preventing code leaks: No source code is stored on local machines, and copying code via the clipboard, file transfer, and screen capture can be disabled.
Secure access to internal resources: VDI environments typically operate within the company’s network, granting access to internal resources like databases or internal services without exposing them to the internet.
What can CDEs offer?
CDEs can match VDIs in security and even offer additional advantages, but they might require more effort:
Centralized access control: CDEs also offer centralized access control, often integrated with external providers like Active Directory. However, CDEs add another layer of control through template-based access. For example, in CodeCanvas, a CDE template defines everything a developer needs for a project: the Git repository, required secrets, environment variables, etc. The resulting CDE contains only the resources necessary for a specific project, contrasting with a VDI machine, which typically grants general access. For administrators, this provides additional visibility into developer activity, making it clear which developers are working on specific projects, when they started, and how long they’ve been working.
Prevent code leaks: No code is stored on the local machine. Clipboard restrictions can be implemented at the IDE level, but additional protections, such as file transfer and screen capture restrictions, may require third-party tools.
Secure access to internal resources: As CDEs are deployed in the company’s cloud, it’s easy to organize secure access to internal cloud resources. For example, CodeCanvas lets you link Kubernetes service accounts to specific templates, granting developers automatic access to required cloud resources without manual configurations or permissions.
2. Environment standardization
The second most common reason for adopting remote development and VDIs is the desire to standardize environments across teams. While VDIs offer some level of standardization, CDEs take it to the next level.
Why do companies choose VDI?
VDIs offer some standardization:
Persistent environments and configuration drift: These are essentially personal remote machines tied to individual users. Standardization is achieved by setting up a golden image – a pre-configured baseline environment. However, users treat these environments as personal machines over time, installing additional software or making changes that lead to configuration drift and works-on-my-machine issues.
Non-persistent environments and state loss: These reset to the golden image state after each session. This ensures consistency, but fails in software development since all uncommitted changes are lost when the session ends.
Hybrid environments: Some VDIs offer hybrid approaches to preserving state, such as detaching and reattaching user disks, but these are complex to set up and maintain.
What can CDEs offer?
CDEs offer much better standardization:
Ephemeral environments: CDEs aren’t user-specific but project-specific. They are ephemeral – they’re created when needed and discarded after use. Standardization is achieved via templates that define the base image with tools, a Git repository, environment variables, etc. In CodeCanvas, standardization goes even further:
You can pre-configure the dev environment’s IDE with plugins and personal settings.
You can use the warm-up feature – CodeCanvas pre-creates IDE indexes, builds the project, fetches dependencies, and stores the result as a single volume snapshot. This snapshot is then distributed across all CDEs based on the same template. If you schedule the warm-up task overnight, in the morning, every new dev environment will be ready to go with prebuilt artifacts and a fully indexed IDE.
No configuration drift: Since CDEs are ephemeral and recreated from templates for each task, developers can’t make persistent changes that deviate from the standard.
Preserved state: CDEs can be paused and resumed, preserving the state of the environment, including uncommitted changes. In solutions like CodeCanvas, storage is unmounted when the environment is stopped and remounted when it is resumed.
3. Developer experience
The developer experience is an unavoidable topic in any discussion about remote development. We haven’t met a customer who was satisfied with VDIs in this regard. One of the core issues is that VDIs were never designed for software development.
What can VDIs offer?
VDIs offer traditional local machine workflows. VDIs were originally designed to replicate traditional desktops in a remote environment, focusing on general user applications rather than specific software development needs.
Latency and performance issues: In every single interview we conducted, this was the top complaint from VDI users. VDIs rely on protocols like RDP, PCoIP, or HDX to stream the entire desktop interface to the user’s device. This approach highly depends on network quality and struggles to maintain the responsiveness needed for software development, where frequent keystrokes and rapid code navigation are common. “When it was a good day, the quality was decent – almost like working locally, except that I couldn’t use a dual-monitor setup. But most days? Typing was laggy, and image quality was poor. It was frustrating.”
Resource limitations: VDI environments are often under-provisioned for development tasks. Compiling large projects or running intensive tests can strain shared VDI servers.
One environment, many tasks: Developers typically work on multiple tasks using the same VDI environment. This means manually checking out different branches, installing dependencies, and waiting for the IDE to index the project each time they switch tasks.
What can CDEs offer?
CDEs offer a modern, task-oriented workflow. They fundamentally shift the remote development paradigm by being project-specific and using optimized communication protocols.
Latency and performance issues: Instead of streaming the entire desktop interface, only the IDE backend runs remotely, communicating with the local client via highly efficient data protocols. These protocols are far less bandwidth-intensive than video streaming, though they also require a stable network connection (latency below 100ms).
Resource limitations: CDEs are ephemeral and can be provisioned with the exact resources and configuration needed for a specific project. As CDEs rely on cloud infrastructure, they are limited only by the cloud provider’s instance types. Moreover, with solutions like CodeCanvas, it’s possible to provision environments with GPU instances for tasks like ML model training.
One environment, one task: CDEs shift the focus from single user-centric machines. For example, CodeCanvas is built around the concept of short-lived environments. Developers create a new environment for each task: bug fixing, feature development, or code review. The environment is fully pre-configured for the task (e.g. with the correct branch checked out, dependencies installed, and the indexes built) and is ready to use. After the task is done, the environment is deleted.
4. Costs
VDIs are notorious for their high costs, and one of the most common questions we hear from customers is whether switching to CDEs will save money. However, this question has no straightforward answer, as it depends on many factors.
What can VDIs offer?
VDIs have high fixed costs with not-always-efficient resource utilization:
Persistent VMs: VDIs are often set up with persistent VMs, allocating resources even when the machine is unused. In some cases, companies leave machines running 24/7 to avoid the overhead of starting and stopping them.
Infrastructure costs: The infrastructure required to run VDIs (servers, storage, networking) demands significant upfront investments. Scaling up adds further ongoing costs.
What can CDEs offer?
CDEs offer cost optimization. While CDEs rely on cloud infrastructure, which is inherently expensive, they offer more efficient resource usage. Environments are created on demand, and once they’re stopped, the resources are deallocated. CodeCanvas, for example, includes several features to optimize costs:
Storage optimization: CodeCanvas can convert volumes of stopped environments from expensive block storage to cheaper object storage, further optimizing costs.
Although these measures can help reduce costs, let’s be realistic: Cloud infrastructure isn’t cheap, and the overall infrastructure bill for CDEs may not always be lower than for VDIs.
However, the actual savings with CDEs often come from reducing non-productive timerather than direct infrastructure costs. With CDEs, developers get ready-to-work environments, allowing them to start coding immediately without waiting for the environment to be set up.
Key takeaways
VDIs have their place in a wide variety of use cases, such as strict security policies and general-purpose remote desktops. However, they fall short in software development due to their limitations in UI responsiveness, standardization, developer workflow, and cost efficiency. CDEs, on the other hand, are purpose-built for software development, offering:
An improved developer experience with low-latency communication protocols.
Task-specific, ephemeral environments.
Preconfigured templates for standardization.
While switching from VDIs to CDEs requires effort and investment, the long-term benefits to developer productivity, standardization, and cost efficiency make it a worthwhile transition. If you’re considering migrating from VDIs to CDEs, we recommend starting with a pilot project to evaluate the new approach’s benefits and challenges.
For more information on CDEs and how JetBrains can help you transition, visit the CodeCanvas product page and contact our team. We’re always happy to answer any of your questions!
If you saw our blog post about using Qodana in Unity and .NET projects, you know that we’ve been striving to explore Qodana’s potential for game development. What’s our next stop on this mission? Seeing our code quality platform in action with Unreal Engine, one of the most popular engines for different types of projects – from virtual reality prototypes to triple-A games.
In this post, we’ll demonstrate how we used our static analysis tool Qodana on Lyra Starter Game, a widely known sample project from Epic Games. We chose this project for its large codebase, which provides a wider range of potential issues to identify, analyze, and fix.
The analysis and the resolution of issues were carried out by a junior developer. Our goal was to check how someone still building their game development knowledge can use Qodana to improve code and product quality.
Table of Contents
Running Qodana from the IDE
We started by running Qodana from an IDE (Rider) to see the initial results and set up filtering. As Qodana is integrated with the most popular JetBrains IDEs, it can be easily launched directly from the Tools menu. For a better team experience, we also recommend using the JetBrains CI/CD solution, TeamCity. After setting up we will switch that on as well to set up a seamless process and quality gate.
Running Qodana in the IDE
You can run Qodana in your IDE without a token, but we wanted our results to be accessible from Qodana Cloud, a cloud-based tool for Qodana reports. To upload a report to the cloud, you need a license token, which you can get from the Qodana Cloud project. We will also use the token to integrate our analysis into the CI/CD pipeline.
The qodana.yaml file is created automatically and shown in the popup below.
The qodana.yaml popup
You can modify this file directly in the popup window if you need to, and you can run inspections with theqodana.starterprofile to check if there are any critical errors. Once you run it, the file will be saved in the project root. We wanted to use a custom profile, so we modified this file to reference the custom profile.yaml.
In the qodana.yaml file, we left a link to the profile. QDNET is a linter based on the Rider distribution and designed to work with Unreal Engine projects.
version: "1.0"

#Specify IDE code to run analysis without container (Applied in CI/CD pipeline)
ide: QDNET

#Specify inspection profile for code analysis
profile:
  path: profile.yaml
qodana.yaml
In the profile.yaml file, we changed the profile to the more extensive qodana.recommended and identified scope to be excluded from the analysis. We wanted to analyze only the project codebase, without Unreal Engine or plugin sources.
These changes provided a relatively comprehensive analysis report.
We then linked our project to Qodana Cloud.
Linking the project to Qodana Cloud
This will allow us to access future reports withinin the IDE and view problems locally.
The report in the IDE
Setting up the CI/CD pipeline
We already had a CI/CD pipeline in TeamCity, which we used to build the project every time we pushed changes to the main branch. There are several ways to complete the build. One such method is with the Unreal Engine plugin for TeamCity which can be downloaded from JetBrains Marketplace. You don’t have to run the build before running Qodana, but it is convenient to put it in the same pipeline. This allows TeamCity to mark the build as Failed if Qodana finds any issues.
To run the Qodana analysis, we added a PowerShell step that loaded and ran our Qodana CLI tool. We opted for the latest AMD64-compatible version and assets for our agents. If you are working with a different operating system and architecture, you will have to choose the assets designed for them.
Before implementing this in any project, you should discuss the security implications with the people responsible for this in your organization. Downloading a third-party binary without checking its integrity and checksum can be risky. You may need to save a fixed version of the binary yourself or verify the checksum of the downloaded distribution.
The linter requires a Qodana token, a value from the project page on Qodana Cloud. To pass the token through the pipeline, we added the QODANA_TOKEN environment variable with the Password value type to ensure the token remains secure.
Then, in the same way, we added the desired version of Qodana CLI as a configuration parameter.
Fixing problems
For this Unreal Engine project, we were particularly interested in issues specific to projects created with the game engine. We used filters on Qodana Сloud to show only these problems.
Unreal Engine problems
Qodana’s sunburst diagram provides a convenient visualization of the detected issues, as well as an easy way to navigate to them. In our case, we could see there were seven types of problems, some of which could be resolved using context actions:
BlueprintCallable function can be made const
BlueprintCallable function can be made static
Use of a class that has not been declared previously
To quickly navigate to these issues in the IDE, we can click on the Open file in Rider button.
Please note: to get this functionality to work you have to install JetBrains Toolbox on your computer.
Example of a problem in Qodana Cloud
After opening the file in the IDE, we resolved this problem using the relevant quick-fix with a context action.
Example of a problem in the IDE
You can also navigate by opening a report locally in the IDE and going through the list of problems grouped there by type, fixing them one by one. As you fix problems in the IDE, the number of issues detected will decrease.
We decided not to fix problems like BlueprintCallable function is never used in Blueprint or C++ code, as the Lyra project is considered learning material, and it’s actively maintained. The project contains methods that are not currently being used but may be in the future.
Additionally, we decided not to fix inconsistent Unreal Engine naming problems because the project uses a different naming convention, where upper case is used for all abbreviations.
Example of a naming problem in the IDE
To deactivate these inspections, we added their inspection IDs toprofile.yaml and set the enabled property to false, ensuring these types of problems will no longer be shown in reports. The problem ID can be found in the qodana.sarif.json file.
Next, we moved to C++ problems. We decided to only fix the problems that were categorized as higher than moderate severity, as most low-level issues could be fixed with quick-fixes. We excluded the non-critical issues by changing the profile.yaml file.
This produced a report with less than a thousand problems. To experiment with different filtering strategies, we used separate branches for each YAML file. This allowed us to divide the problems into groups based on type, tackling each type in a separate branch with different settings and then merging the branches.
Low-severity C++ problems excluded
Even without the low-level results, we saw many types of problems that were not in the Unreal Engine category.
In total, our team fixed 822 of 937 problems from the categories we examined next.
As you can see below, the most common problems fell into the Common Practices and Code Improvements category and included issues like variables that could be made const or static. We resolved most of them with quick-fixes. We left problems like Function is not implemented, as they could be fixed in future development. We decided not to fix some of the problems, as the changes required to mitigate them would make the project uncompilable and in need of further refactoring.
Problems classified as Common Practices and Code Improvements
As a result, we were left with only 26 problems in the Common Practices and Code Improvements category, which we could deal with later.
Remaining problems classified as Common Practices and Code Improvements
Up next were potential code quality issues. From this category, we fixed problems where we needed to remove unused declarators or directives. We then moved to redundancies in code, most of which were resolved easily with a quick-fix. We did not address any problems where developers left comments with their plans or TODOs because we assumed that these problems would be fixed with future changes.
Example of a TODO
Last but not least, the Syntax Style category contained only two types of problems, both of which concerned the use of virtual and override specifiers when overriding functions. We fixed all of them by adding the missing specifiers.
Syntax Style problems
We were left with 123 unresolved problems, either due to ongoing development or the lack of a feasible solution. We moved these issues to the baseline. To apply the baseline, we downloaded the baseline file and stored it in the repository.
Selecting problemsDownloading the baseline file
Then, by adding the –baseline parameter and path to the file, we adjusted the pipeline to include the baseline in future analyses.
If our team decided to continue working on this project, we could fix new problems as they appeared or we could focus on eliminating problems from the baseline, depending on our priorities.
We set up a quality gate to enforce the standards we had achieved with these efforts, and we added a several failureConditions section to qodana.yamlto configure additional quality gates for the total number of problems, as well as the numbers of critical and high-severity issues. Going forward, if any of these limits are exceeded, the build will fail.
failureConditions:
severityThresholds:
any: 10 # Total problems
critical: 0 # Critical and other severities
high: 5
Added qodana.yaml configuration
We also adjusted the execution of qodana-cli to consider exit code, failing the build if the result fails the quality gates. By failing builds that don’t meet our quality criteria, we can identify and address issues immediately.
Invoke-WebRequest -Uri "https://github.com/JetBrains/qodana-cli/releases/download/%VERSION%/qodana_windows_x86_64.exe" -OutFile "qodana_windows_x86_64.exe"

./qodana_windows_x86_64.exe scan --ide QDNET
# Capture the exit code of the command
$exitCode = $LASTEXITCODE
# Print the exit code
Write-Output "Exit code: $exitCode"
# Exit the script with the same exit code
exit $exitCode
PowerShell build step
A failed build in TeamCity
Qodana’s Unreal Engine analysis summarized
We successfully analyzed the Lyra project, got a detailed report, and fixed more than 800 problems. While conducting professional reviews will likely require a deeper understanding of Unreal Engine, Qodana’s analysis still helped a single junior developer clean up the code and make it more concise.
For large-scale projects like Lyra, Qodana can effectively highlight and prioritize critical code issues that may be overlooked in manual reviews.
Since Lyra is a private repo, we can’t share the outcome, but we hope we’ve shown you how this process could work for your team and what kind of results it can deliver.
Switch to Qodana for code analysis and get 25% off
Qodana gets better with every release and provides a cost-effective way for teams to build confidence in code quality.
With this in mind, we’re offering you 25% off your first year of Qodana if you switch from a comparable commercial solution. Click on the button below to speak to our team.
We’re excited to announce the release of TeamCity On-Premises 2024.12.1, a bug fix update that resolves over 80 issues reported by users. This version includes crucial fixes across multiple areas, ensuring enhanced performance, stability, and security for your CI/CD pipelines.
Some highlights of this release include:
Resolved truncated build tags, addressing an issue that impacted tag visibility.
Fixed possible agent hang-ups during artifact publishing.
Support for MySQL 8.4 by adding allowPublicKeyRetrieval to the database connection URL (TW-91529).
Fixed SSH agent build feature issues on Windows (TW-85769).
We recommend upgrading to apply the latest improvements and security fixes to your TeamCity server.
Why update?
Staying up to date with minor releases ensures your TeamCity instance benefits from:
Performance improvements.
Better compatibility with integrations.
Faster, more stable builds.
Enhanced security for your workflows.
Compatibility
TeamCity 2024.12.1 shares the same data format as all 2024.12.x releases. You can upgrade or downgrade within this series without the need for backup and restoration.
How to upgrade
Use the automatic update feature in your current TeamCity version.
Thank you for reporting issues and providing feedback! If you have questions or run into any problems, please let us know via the TeamCity Forum or Issue Tracker.
TeamCity is officially listed on AWS Marketplace! This milestone makes it even easier for teams to integrate the power of TeamCity into their CI/CD pipelines while leveraging the scalability and flexibility of Amazon Web Services (AWS).
TeamCity interface
Whether you’re already an AWS user or exploring AWS for your next project, TeamCity on AWS Marketplace simplifies access to one of the most robust CI/CD platforms in the industry.
Advantages for DevOps teams
The TeamCity listing on AWS Marketplace brings several key benefits that streamline and enhance CI/CD workflows. Here’s how it’s helpful.
Simplified procurement
TeamCity seamlessly integrates with your existing AWS subscription, streamlining billing and management into a unified process. With funds already allocated or billing pre-configured in your AWS account, procurement becomes faster and simpler – no need to navigate lengthy approval processes, request additional quotas, or handle complex purchase orders.
Faster deployment
Pre-configured solutions optimized for the AWS environment let you get up and running with TeamCity in just a few clicks.
Effortless scalability
Leverage AWS’s cloud capabilities to effortlessly scale your CI/CD infrastructure, ensuring it keeps pace with the demands of your growing projects.
Why choose TeamCity for AWS?
TeamCity is a robust and flexible CI/CD platform that seamlessly integrates with AWS’s scalable and reliable infrastructure. It equips teams with powerful tools to:
Accelerate development – Run parallel builds and tests to receive faster feedback and iterate quickly.
Streamline workflows – Optimize complex pipelines with intelligent configuration assistance and automation.
Strengthen security – Leverage built-in features such as access management and audit logging to safeguard your CI/CD processes.
Gain valuable insights – Access detailed build and test reports to make informed decisions and improve software quality.
By combining TeamCity’s capabilities with AWS, you can build, test, and deploy with greater efficiency and confidence. Learn more about the TeamCity and AWS integration on our website.
Staying up to date with minor releases ensures your TeamCity instance benefits from:
Performance improvements.
Better compatibility with integrations.
Faster, more stable builds.
Enhanced security for your workflows.
Compatibility
TeamCity 2024.12.2 shares the same data format as all 2024.12.x releases. You can upgrade or downgrade within this series without the need for backup and restoration.
How to upgrade
Use the automatic update feature in your current TeamCity version.
Thank you for reporting issues and providing feedback! If you have questions or run into any problems, please let us know via the TeamCity Forum or Issue Tracker.
This post was brought to you by Matt Keib, draft.dev.
Dynamic application security testing (DAST) is a security testing method designed to identify vulnerabilities in applications while running. Unlike static testing methods, which analyze code at rest, DAST interacts with live applications and mimics real-world attacks to uncover security flaws. This makes DAST particularly effective for detecting issues that only occur when an application is running.
Within the bigger picture of security testing methodologies, DAST stands out for targeting the operational state of applications and APIs. Unlike static application security testing (SAST), which analyzes source code, or interactive application security testing (IAST), which combines runtime testing with code analysis, DAST focuses on identifying vulnerabilities that arise only during application execution.
Thanks to its ability to simulate real-world attacks on live web applications and APIs, DAST can help uncover issues like authentication flaws, configuration errors, and runtime vulnerabilities, which are weaknesses often missed by static methods. This makes DAST an essential component for securing applications in production environments and protecting them against external threats.
In this article, you’ll learn about DAST fundamentals, when it’s appropriate to use it, and how TeamCity can help you maximize its effectiveness.
What DAST is and how it works
DAST’s primary function is to assess live applications from an attacker’s perspective to identify runtime vulnerabilities. DAST uses an outside-in (or black box) testing approach, which evaluates applications in their runtime environment without resorting to accessing source code or internal details.
Unlike other application security tools that analyze internal structures, DAST mimics external inputs by malicious actors and examines how the application responds, providing unique insights into potential vulnerabilities. In other words, the tool attempts to perform the very same exploits an attacker would in a real attack situation.
One of the defining characteristics of DAST tools is their ability to provide actionable insights, including comprehensive reports detailing vulnerabilities, potential impacts, and remediation recommendations.
These tools not only identify flaws, misconfigurations, and issues in a running application but also provide recommendations on how to properly address them. This is especially important today, as developers must balance tight deadlines with meeting compliance standards and implementing guidelines that safeguard customer data from breaches and unauthorized access.
DAST vs. other types of security testing
While DAST excels at runtime testing, other methods like SAST and IAST address different stages of the development lifecycle. SAST analyzes source code before execution, helping developers catch issues early during coding (this approach is also known as shift-left).
On the other hand, IAST combines elements of both static and dynamic testing, offering insights by monitoring the application during runtime while also linking findings to the specific code that raised concerns. This helps developers reduce overhead while focusing on the faulty segments they must fix to remediate active vulnerabilities.
Unlike SAST, which focuses on internal code structure, DAST evaluates the application from an external perspective, making it indispensable for detecting vulnerabilities that arise only during execution.
For example, a runtime vulnerability like exposing sensitive data in API responses or failing to invalidate a session after logout could go unnoticed in static analysis but would be detected by DAST.
Compared to IAST, DAST is less invasive, as it doesn’t require integration into the application’s codebase or runtime environment, nor does it involve deploying sensors into the source code.
This simplicity makes DAST easier to implement and allows teams to switch between DAST tools with minimal friction if needed.
To enhance security, DAST should be combined with SAST for broader visibility into risks. Modern DAST tools can seamlessly integrate into DevOps and CI/CD pipelines, enabling early-stage vulnerability mitigation through a shift-left approach.
Key features of DAST tools
DAST tools provide a range of features designed to streamline and enhance the security testing process, including:
Scanning and mapping: DAST tools initiate the testing process that simulates user interactions with the application. They send HTTP requests to map out all pages, links, functions, and entry points, including those defined in API documents. This step ensures thorough coverage of the application by uncovering all potential flaws that may open a door to attackers.
Analysis of application responses: The tool then examines the application’s responses, looking for anomalies, error messages, and unexpected behavior that could indicate vulnerabilities. Identified issues, such as misconfigurations or runtime errors, are recorded for further review.
Attack simulation: At this stage, DAST simulates common attacks like SQL injection, cross-site scripting (XSS), and cross-site request forgery (CSRF) to detect vulnerabilities. This process highlights issues such as input validation flaws, authentication errors, and data exposure risks that malicious actors could exploit.
Comprehensive reporting: After scanning and analysis, DAST tools generate detailed reports that outline detected vulnerabilities together with their severity, as well as suggested remediation steps. These reports guide development and security teams in prioritizing fixes timely and effectively.
This is very useful for complying with the respective SLAs of security teams, ensuring a swift resolution of incidents and improving the organization’s overall security posture. Additionally, granular reports are useful for internal communications such as those with the board or stakeholders, where security teams provide updates about the application’s security posture.
Potential false positives: To ensure accuracy, modern DAST tools include mechanisms to minimize false positives. However, human validation and prioritization are often necessary to confirm the relevance and impact of flagged vulnerabilities.
These features enable teams to proactively identify and address potential security flaws, minimizing risks and enhancing overall application security.
Best practices for effective DAST
Implementing DAST effectively requires a strategy that prioritizes regular and comprehensive scanning to ensure consistent identification of risks and vulnerabilities.
Regular scans help you stay ahead of emerging threats and verify that updates or new features of the application don’t introduce security gaps.
In-depth coverage should include all aspects of the application, including APIs and single-page functionalities, to ensure no critical vulnerabilities remain hidden.
Scheduling scans at regular intervals or after significant updates will contribute to consistent monitoring and reduce the chances of overlooking new vulnerabilities or entry points for attackers.
Combining DAST with other application security testing tools
Integrating DAST with other security testing efforts enhances an organization’s security posture by addressing vulnerabilities at different stages of the software development lifecycle.
Combining DAST with SAST allows teams to identify both static and runtime vulnerabilities, ensuring a more detailed risk assessment. While SAST analyzes the application’s source code for structural weaknesses, DAST focuses on vulnerabilities that emerge during runtime, offering visibility on vulnerabilities that may have slipped into production unnoticed.
Including IAST in the mix bridges the gap between static and dynamic analysis by providing insights during application execution and linking vulnerabilities to specific sections of the code.
Manual testing adds further depth in identifying context-specific risks or logic flaws that automated tools might overlook. Together, these methods create a layered security approach that reduces the likelihood of missed vulnerabilities.
For example, consider an e-commerce application that processes user payments. SAST identifies a hard-coded API key in the source code, which is flagged as a potential security risk early in development.
Later, during runtime testing, DAST detects that the same API key is being transmitted in plaintext over an insecure connection, exposing it to interception. Meanwhile, IAST links the issue to the specific code responsible for establishing the insecure connection, enabling the team to pinpoint and fix the root cause quickly.
Manual testing then verifies the fix and ensures no other related vulnerabilities exist, providing confidence in the resolution.
A layered strategy not only maximizes coverage but also simplifies remediation efforts. For example, early-stage issues detected by SAST can be resolved before reaching runtime, reducing the scope of vulnerabilities flagged during DAST scans.
Similarly, manual testing can validate and prioritize findings from automated tools and narrow down findings through a human-based dismissal of false positives, ensuring that resources are focused on the most critical risks.
Handling false positives and false negatives
First-generation DAST tools were often criticized for generating a significant number of false positives, creating extra workload for developers and security teams. In addition, they lacked automation capabilities and complete vulnerability validation.
Current DAST tools can integrate with others like SAST, which helps confirm findings and reduce noise through the combination of different testing methods. Modern versions of DAST tools can cross-reference results, minimizing both false positives and false negatives, reducing overhead, and ensuring issues are detected.
Additionally, modern DAST tools use advanced techniques like machine learning to improve accuracy. For instance, machine learning algorithms can analyze patterns in past scans to better distinguish legitimate vulnerabilities from false positives and continuously refine their detection capabilities.
Other techniques, such as context-aware analysis and correlation with real-world attack patterns, further enhance their ability to detect meaningful issues while reducing overhead.
Other techniques for managing false positives include tuning DAST configurations to match application-specific requirements and using predefined rule sets to exclude known, safe, and expected behaviors. Regularly updating vulnerability libraries ensures the tool accurately identifies real threats while reducing the likelihood of false positives caused by outdated patterns.
False negatives can be resolved using manual reviews with DAST or combining it with IAST, which links detected vulnerabilities to specific code components for deeper insights.
This way, organizations can ensure that DAST results are more accurate and actionable, and security teams have better data to prioritize and remediate vulnerabilities effectively.
How TeamCity can help
TeamCity is a CI/CD solution that integrates DAST into CI/CD pipelines, embedding security testing directly into the development workflow. With its robust support for a wide range of languages and technologies, TeamCity ensures that projects of any size – whether they involve small teams or enterprise-scale applications – can seamlessly integrate DAST tools into their workflows.
Automating builds, tests, and deployments allows TeamCity to embed DAST scans at key stages of the software development lifecycle. Its integration capabilities extend to popular DAST tools, ensuring security testing runs alongside other CI/CD activities without disrupting productivity.
The platform’s detailed build logs and visual build chains provide insights into test results, making it easier for developers to pinpoint and address security vulnerabilities early.
TeamCity reinforces a shift-left approach to security, ensuring testing is integrated earlier in the development cycle. Automated testing features, such as test parallelization and flaky test detection, help developers maintain high-quality code while uncovering potential runtime vulnerabilities. With its emphasis on automation, scalability, and user-friendly integrations, TeamCity empowers teams to build secure and reliable software with confidence.
Conclusion
Identifying vulnerabilities during runtime allows DAST to address gaps left by other testing methods for thorough coverage of potential security flaws. Combining DAST with tools like SAST and IAST creates a layered security approach that maximizes visibility and optimizes remediation efforts.
Before adopting DAST, evaluate your current security practices to identify areas where it can make the most significant impact, such as detecting runtime vulnerabilities in environments with third-party dependencies, rapidly changing codebases, and tight release schedules tracked through DevOps metrics.
Once gaps are identified, the next step is to select a DAST solution that aligns with your team’s workflows and objectives. Choose a tool that integrates seamlessly into your development pipeline, allowing for regular scans and effective analysis of results.
Incorporating these findings into your workflow ensures vulnerabilities are prioritized and resolved efficiently, reducing risks, enhancing productivity, and maintaining the speed and agility demanded by modern development practices.
TeamCity is a reliable solution that can support these efforts by offering seamless integration of DAST tools into CI/CD pipelines. Its complete set of features, such as automated testing and detailed build insights, empowers teams to detect and remediate vulnerabilities efficiently. With TeamCity, organizations can strengthen their security posture without compromising development speed or agility.
This tutorial was brought to you by Kumar Harsh, a software developer and technical author.
If you regularly work with React projects, you probably already know how tricky it can be to deploy them smoothly. Issues like manual errors, inconsistent deployment practices, and slow iteration cycles often turn React app deployment into a challenging process and a source of frequent headaches. Effective use of automation can help reduce those headaches and significantly improve the transition from code to users.
TeamCity, a continuous integration and continuous deployment (CI/CD) platform from JetBrains, is designed to simplify deployment pipelines. It offers features like build automation and optimization, detailed test reporting, and secure credential management.
By securely automating your deployment workflow, TeamCity helps reduce errors, improve consistency, and accelerate delivery, allowing your team to focus on building great applications.
In this tutorial, you’ll learn how to set up an automated deployment pipeline with TeamCity Pipelines. You’ll learn how to configure TeamCity to deploy a React app from a GitHub repository to an Amazon S3 bucket, making it ready to serve as a static website.
Prerequisites
Before you get started, here’s what you’ll need to follow along:
A GitHub account.
An AWS account. The pipeline you’ll create in this tutorial will deploy the final app to an Amazon S3 bucket. Since you only need to use S3, a free AWS account will work.
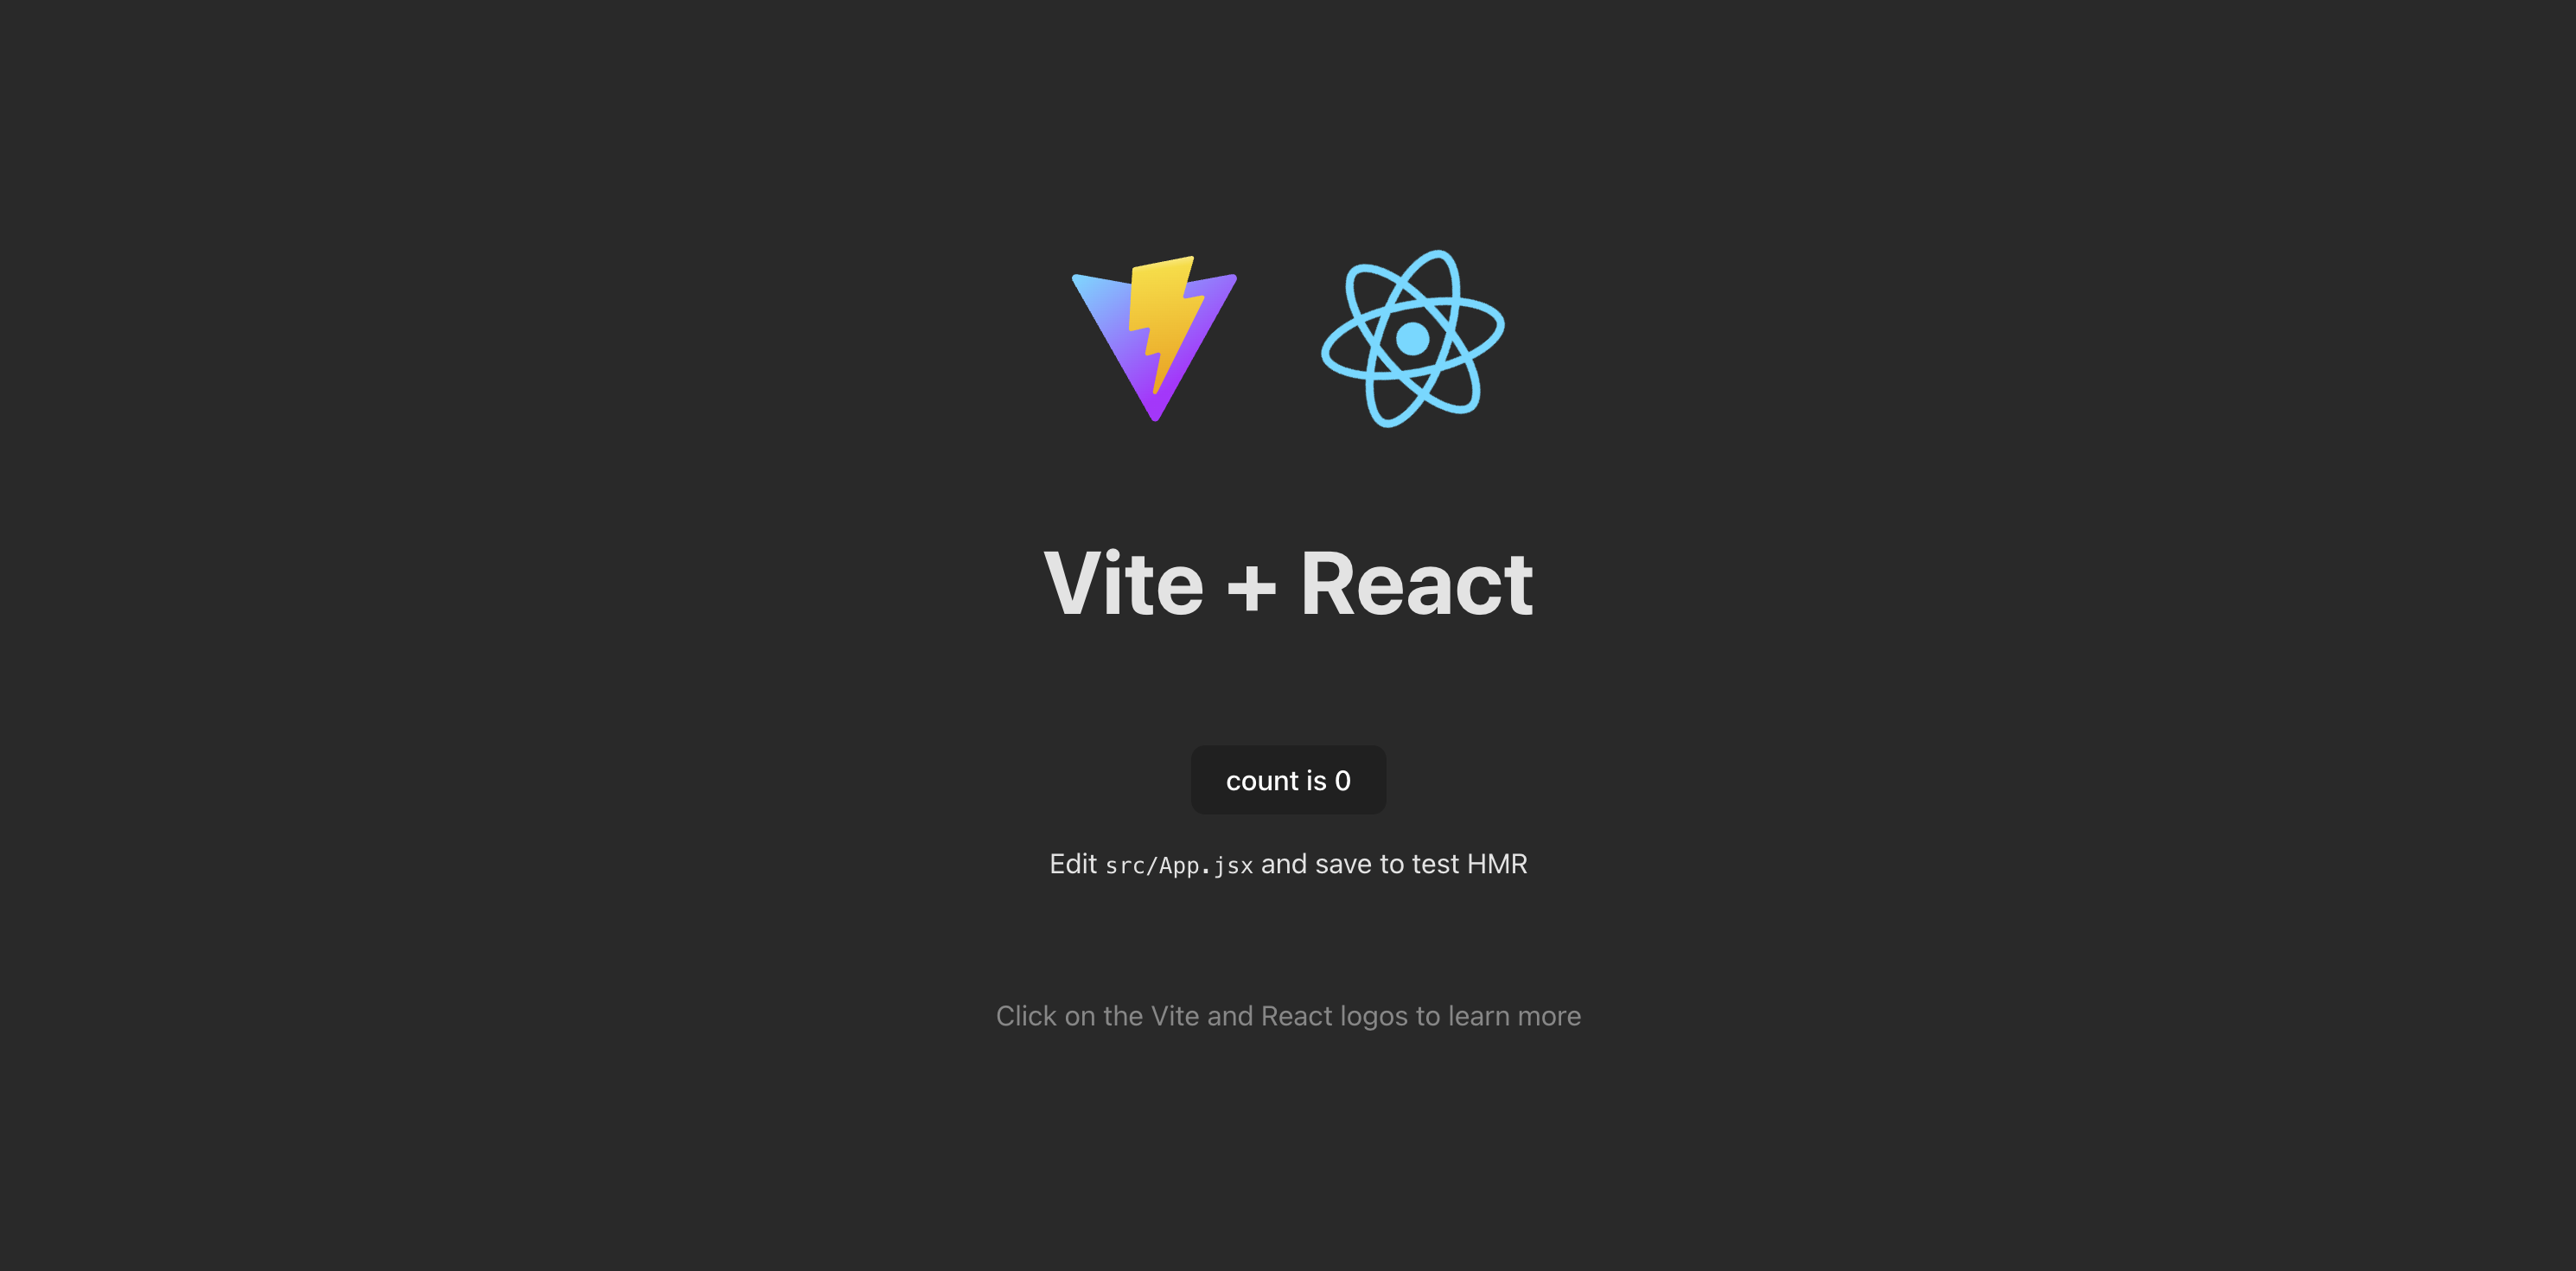
The above repo contains a React 18 app created using Vite. The app’s home page displays framework logos and includes a button that tracks how many times it’s clicked:
Output of the React app
The repo also contains two integration tests in the src/App.test.jsx file that check whether the App component is rendered and if the button and the counter are working.
You can enter the following commands in a terminal window at the root of the repo to run the tests for yourself:
yarn && yarn test
Here’s what the output should look like:
RUN  v0.34.6 /Users/kumarharsh/Work/Draft/teamcity-react/teamcity-react-test-app

 ✓ src/App.test.jsx (2)

   ✓ App (2)

     ✓ renders

     ✓ should increase count by 1

 Test Files  1 passed (1)

      Tests  2 passed (2)

   Start at  23:05:51

   Duration  642ms (transform 31ms, setup 0ms, collect 146ms, tests 26ms, environment 284ms, prepare 51ms)

✨  Done in 1.61s.
This indicates that the tests ran successfully on your local system. At this point, you’re ready to start building the CI/CD pipeline.
Setting up TeamCity
Let’s start by creating a new pipeline in TeamCity. Once you’ve signed up for TeamCity Cloud, you should see a loading screen:
TeamCity Cloud server starting
Once the server is up, here’s what the dashboard should look like:
TeamCity Pipelines dashboard
Click the blue Create new pipeline button in the middle of the page, then authenticate with your Git platform:
Logging in to a VCS provider
Authenticate with GitHub once again. TeamCity will then ask you to choose the repo you’d like to deploy in your first pipeline. Type “teamcity-react-test-app” in the search bar:
Choosing your forked repo
Select the forked repo and click Create:
Creating the pipeline
This will set up your new pipeline. Here’s what its Editpage should look like:
Newly created pipeline
At this point, you’re ready to start developing the steps and jobs in the pipeline.
Creating a simple, sequential pipeline
You’ll first create a straightforward pipeline that installs dependencies, runs tests, creates a build, sets up AWS credentials, and finally pushes the built artifacts to the S3 bucket. Then, you’ll optimize it by splitting it into multiple jobs that can reuse steps and run in parallel as needed.
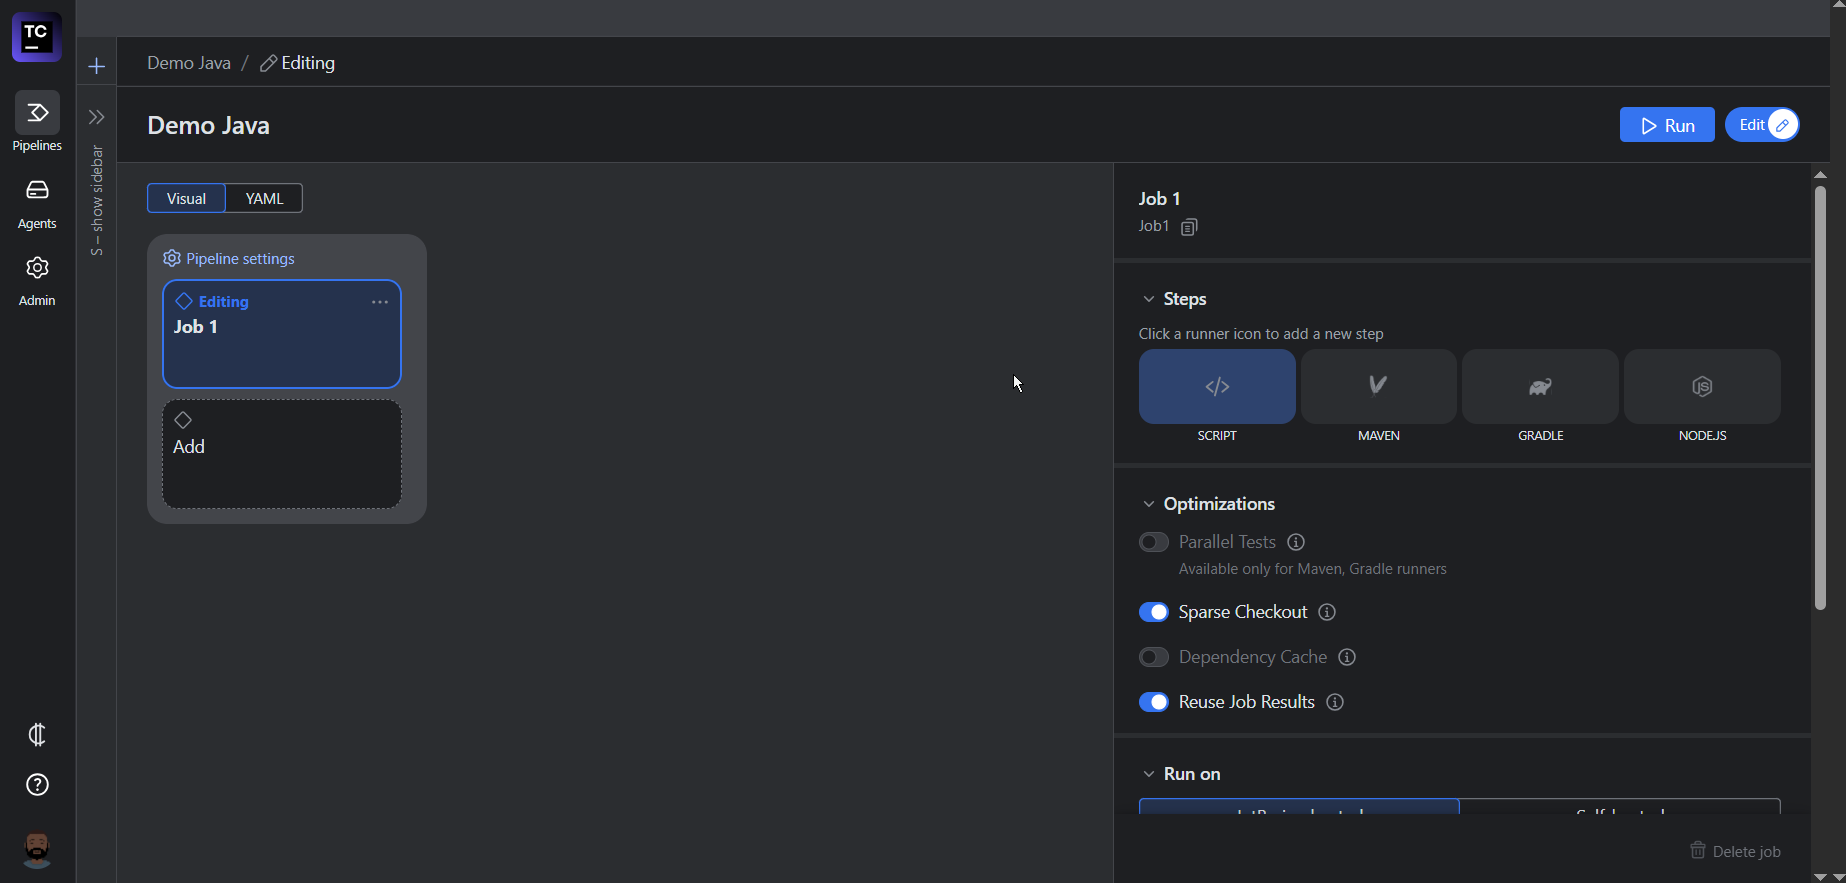
Hover over the name of the job (Job 1) in the right pane and click the pencil icon that pops up to edit the name:
Editing the job name
Rename the job “Deploy to S3.” Then, click the NODE.JS icon under the Steps section to add a Node.js-based pipeline step:
Adding a new step
This will open another sidebar that asks for the details of the steps, including the step name, the working directory (which is the repo root by default), and the shell script you’d like to run as part of this step:
Editing the step details
Enter “Install dependencies” as the step name and yarn for the shell script. Click the blue Done button in the bottom left-hand corner of the sidebar to add the step to the job. Here’s what the job should look like now:
Updated job
Adding the test and build steps
Now, add two more steps to the job with the following details:
“Run test”, with the shell script yarn test.
“Build”, with the shell script yarn build.
Here’s what the job should look like when you’re done adding the two steps:
Updated job with three steps
At this point, you can try out the pipeline to see if it runs the tests and builds the app correctly by clicking the blue Save and run button in the top right-hand corner of the page. Here’s what the output should look like:
Results of the first run
You can expand the sections for each of the steps 1 through 3 to learn more about how they ran. Try expanding step 2 to view the test results. You’ll notice results similar to what you received when you ran the tests locally:
Test execution logs
This indicates that the test and build steps are working correctly.
Preparing the S3 bucket for deployment
As mentioned earlier, you’ll be deploying the built React app to an Amazon S3 bucket. But before you do that, you’ll need to create a new S3 bucket and configure it to serve a static website. You can find detailed instructions on how to do that in this AWS tutorial.
Here’s an overview of the steps:
Create a new S3 bucket with a name (for example, myawsbucket-kh) and default settings.
On the bucket details page, go to the Properties tab. Scroll down to find the Static website hosting section and click the Edit button: Enabling static website hosting
Choose Enable under Static website hosting and specify the Index document as index.html. Click the Save changes button at the bottom of the page when done. Here’s what the Static website hosting section should look like now: Static website hosting enabled You’ll also find the website endpoint at the bottom of this page. This is where you’ll be able to access the website once it’s deployed.
You also need to enable public access to the bucket. To do that, head over to the Permissions tab from the same page and click the Edit button in the Block public access (bucket settings) section: Editing public access settings
On the resulting page, you need to uncheck the Block all public access option and click the Save changes button in the bottom right-hand corner: Enabling public access
Once you’ve enabled public access, you can start uploading files to this bucket and access the website at the URL you retrieved earlier.
Copy and store the S3 bucket name somewhere safe. You also need to generate an AWS access key ID and secret. Before you do that, it’s best to create a dedicated AWS IAM user for the CI/CD pipeline to avoid exposing your admin user’s privileges unnecessarily.
On this page, click the orange Create user button to create a new user. Feel free to give it any name you like. For permissions, choose Attach policies directly under Permission options and search for and add the AmazonS3FullAccess policy to the user. Here’s what the user should look like on the review page:
Reviewing the newly proposed user
Click the Create user button in the bottom right-hand corner of the page. Once the user is created, click its name on the Users page to view its details:
Viewing the newly created user’s details
Here’s what the user details page will look like:
User details
Click the Security credentials tab and scroll down to find the Access keys section:
Finding the access keys section
Click the Create access key button. On the page that opens, choose Command line interface (CLI) under the Use case and check the confirmation checkbox at the bottom of the page before clicking the Next button:
Creating the access key
You can skip adding tags to the access key and click the Create access key button:
Skipping tags and creating the access key
The next page will display the access key and the secret access key values. Copy them and store them safely. You’ll use them in the next step of the pipeline to upload built artifacts to the S3 bucket through the AWS CLI.
You can safely provide your pipeline with the AWS secrets through TeamCity’s secrets. However, the recommended approach to handle infrastructure integration with CI/CD pipelines is to allow administrators to connect and manage cloud platforms while only providing pipelines (and related users) the ability to use those connections as part of the pipeline steps only, with no access to the secret keys or values at all. To learn more about implementing this approach, check out TeamCity’s AWS Connection.
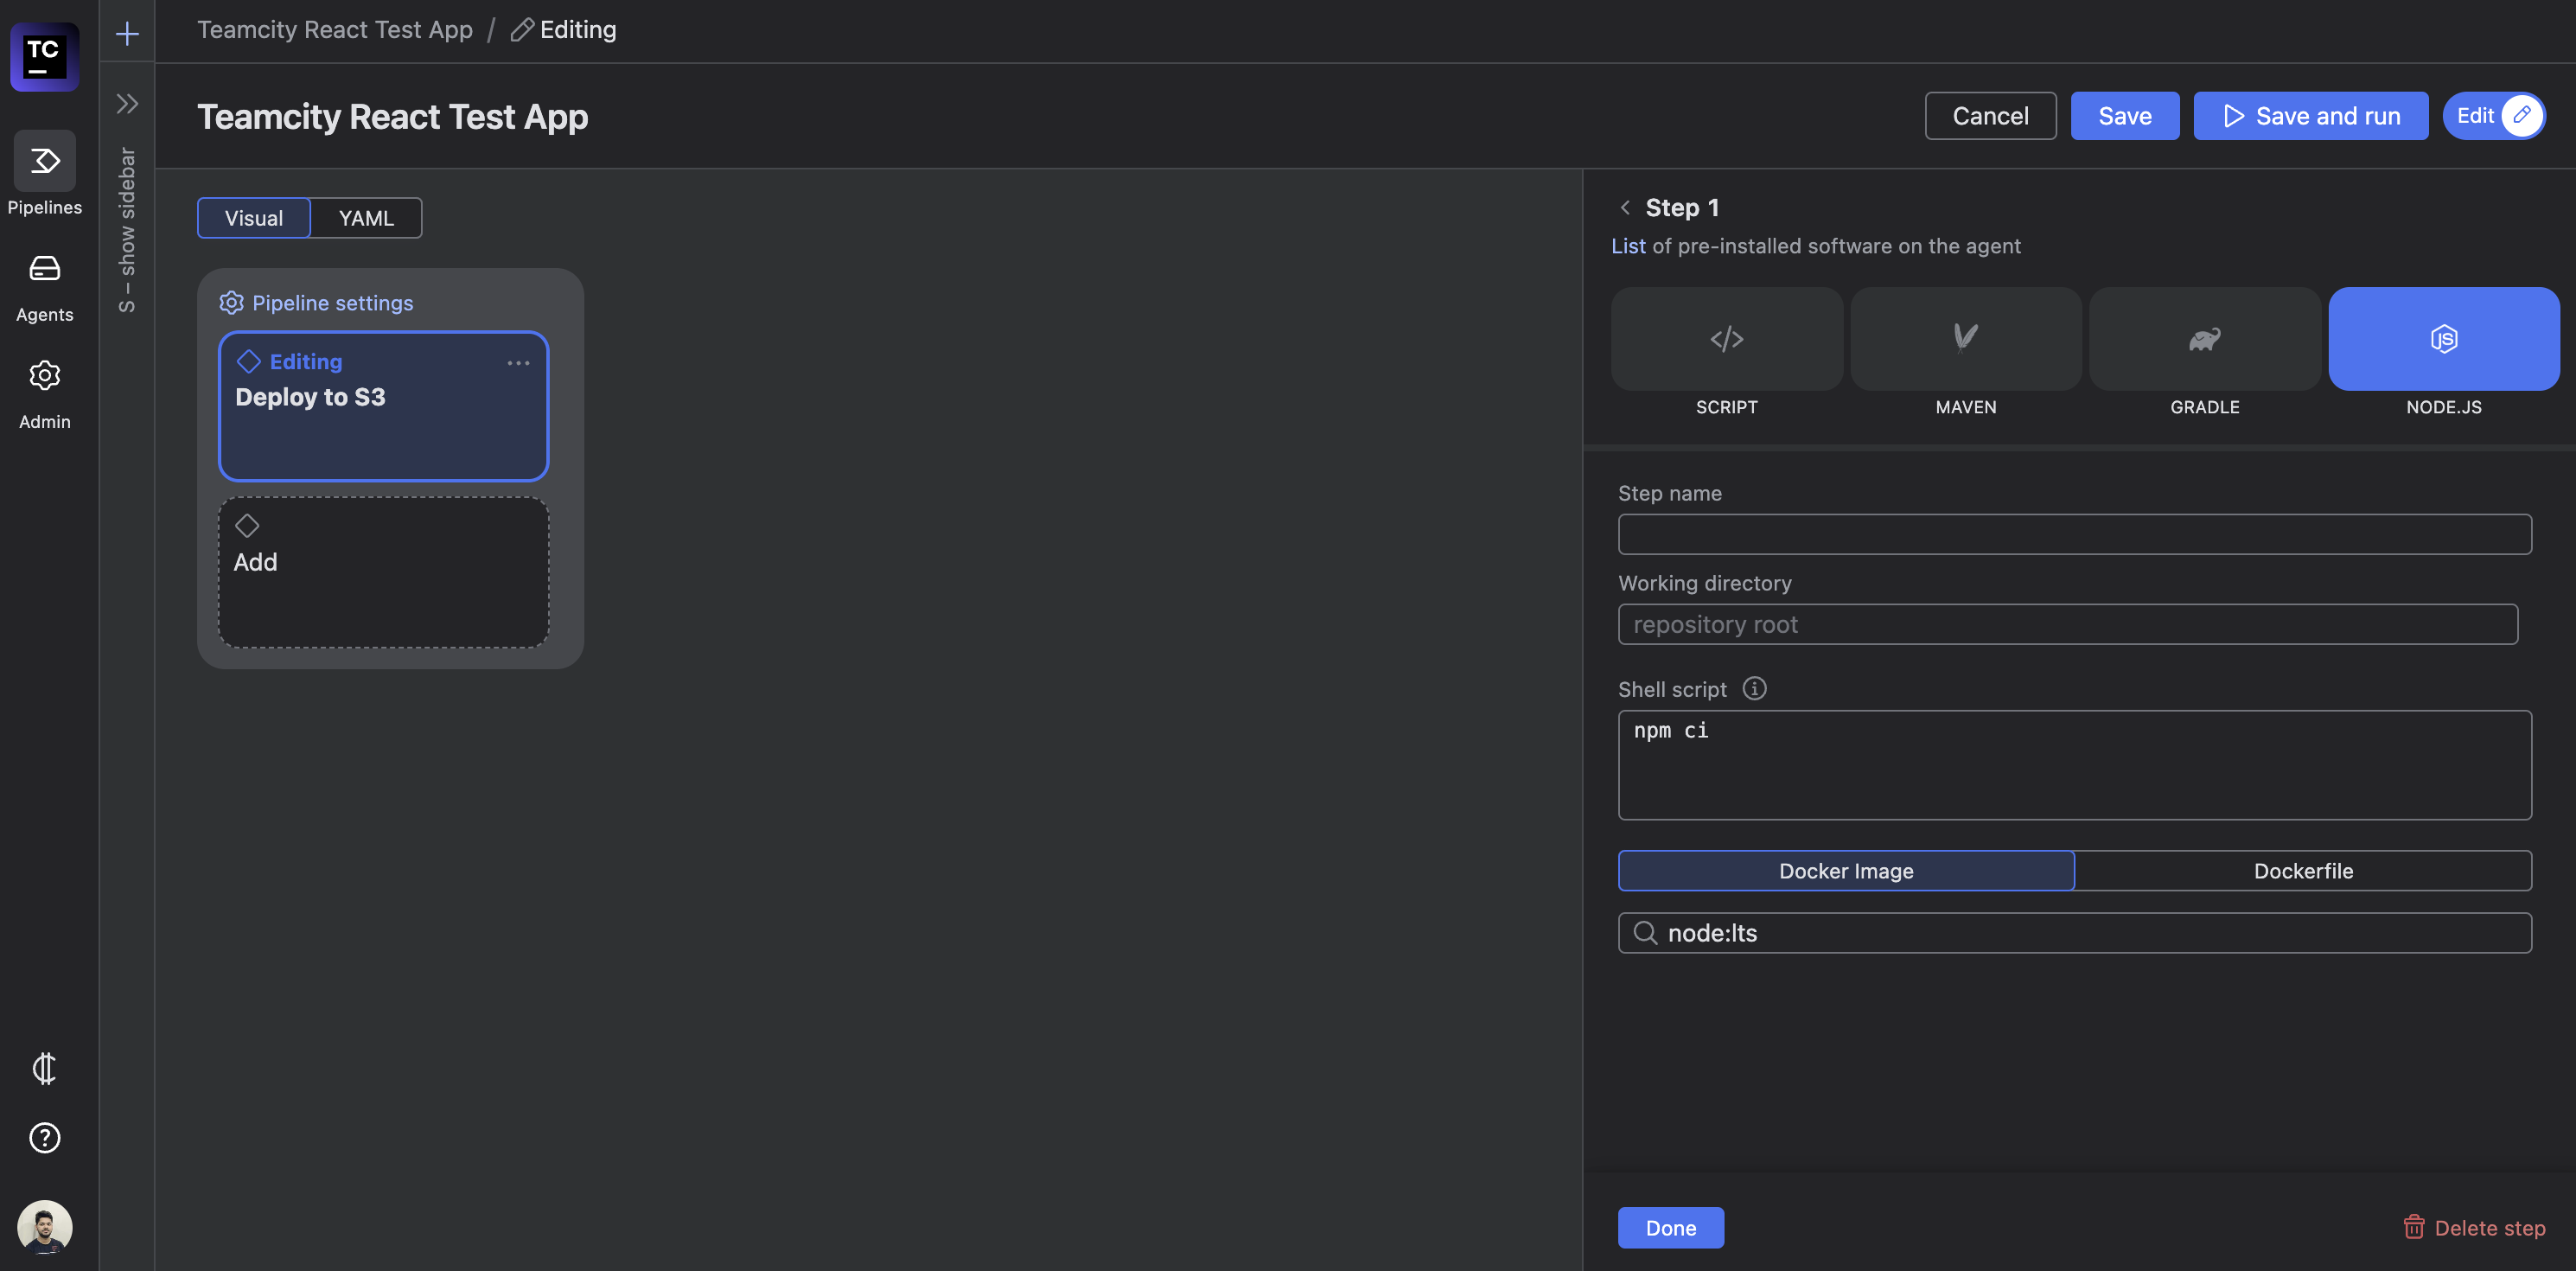
Adding the deploy steps
You now have everything you need to add the deploy steps. To do that, you’ll need to add two more steps to your TeamCity pipeline as you did before.
First, add a step named “Configure AWS credentials.” Set the step type to Script and use the following custom script value:
aws configure set aws_access_key_id "%AWS_ACCESS_KEY_ID%"

aws configure set aws_secret_access_key "%AWS_SECRET_ACCESS_KEY%"
This step uses the AWS CLI to configure your AWS account credentials by accessing the AWS_ACCESS_KEY_ID and AWS_SECRET_ACCESS_KEY TeamCity secrets.
Next, add a step named “Push to S3.” Set its type as Script and add the following custom script value:
With the AWS CLI properly configured, this step will upload the contents of the dist directory (generated by the build step) to the S3 bucket, using the bucket name stored in the TeamCity secret AWS_S3_BUCKET_NAME.
You can use the AWS CLI directly inside the pipeline because it’s preinstalled on default JetBrains-hosted agents. Here’s a list of all the software resources that you get out of the box when using JetBrains-hosted runners on TeamCity Cloud.
This is what the job should look like when you’re done adding the steps:
Deploy steps added to the pipeline
You’ll notice that the “Deploy to S3” job now shows up in yellow with a warning that says “No compatible agent”. This is because some of the steps in the job rely on pipeline secrets that aren’t defined yet. You can fix that by clicking the Pipeline settings link right above the job and clicking the plus (+) icon to the right of the No Secrets section in the right pane:
Adding secrets to the pipeline
This will show some text input fields in that section that will allow you to add secret names and values. You need to add the following secrets:
AWS_ACCESS_KEY_ID: Your AWS access key.
AWS_SECRET_ACCESS_KEY: Your AWS access key secret.
AWS_S3_BUCKET_NAME: The name of your S3 bucket.
Once you’ve defined and saved these values, you’ll notice the yellow highlight and warning text are gone:
Pipeline ready to run
You can now click the Save and run button in the top right-hand corner to save and run the updated pipeline. Here’s what the output should look like:
Test run of the updated pipeline
This means that your app was successfully built and deployed to your S3 bucket. You can check the bucket to see if the files were actually added there:
S3 bucket with build artifacts
You can also visit the public website URL you received earlier to view the deployed website:
Deployed website as a result of the pipeline
Since the pipeline was created with a GitHub VCS repository, it’s automatically configured to monitor the main branch for new commits and trigger whenever it detects changes.
Optimizing the pipeline
You can make some tweaks to optimize this pipeline further. Currently, there are only a small number of tests, which shouldn’t cause a performance bottleneck. However, if you end up having a large number of tests, especially integration tests that might require extensive setup and teardown in some cases, the test step could become quite time-consuming.
The pipeline is configured to only proceed to the build and the deploy steps once the tests have been completed successfully.
If you’re setting up a pipeline on a production branch that only receives commits after they’ve been approved as part of a PR or another review process earlier, you can consider running the tests and the build in parallel to save some time.
If either of the two fails, the deploy step can be skipped since you wouldn’t want to deploy a version that doesn’t satisfy internal tests or if you’re not able to generate a successful build for it.
You can use TeamCity’s parallel builds to achieve this. Since this will require you to split the pipeline into multiple jobs, TeamCity can reuse job results to avoid rerunning jobs if the last run was successful and no new changes have been made since then.
This approach saves CI/CD minutes when testing the pipeline with the same commit multiple times. Alternatively, you can configure the pipeline to reupload (without rebuilding) the website to the S3 bucket if needed.
To implement these optimizations, you’ll first need to split the steps from the “Deploy to S3” job into three jobs.
Create build
The Create Build job will just install project dependencies and create the build. For that, you need to add two steps to it: a Node.js step called “Install dependencies” with the command yarn and another Node.js step called “Create build” with the command yarn build. Here’s what the job will look like when you’ve added the steps:
New build job with two steps
You also need to scroll down and configure the artifacts for this job. Since the output of this job will be used by the “Deploy to S3” job to deploy the app to the S3 bucket, you need to click the plus sign icon to the right of the Artifacts section and enter ./dist/* in the input field that pops up:
Updated artifacts path in the build job
Run tests
Now, create another job named “Run Tests” and add two steps: “Install dependencies” (same as before) and another Node step called “Run tests” with the command yarn test. Here’s what the job will look like when you’ve added the steps:
New tests job
You don’t need to configure any artifacts for this job since it doesn’t generate any output files after running the tests. You could, however, choose to export test results in a file and add another job to the pipeline to upload the results to a test results analysis platform.
Deploy to S3
Finally, you need to update the “Deploy to S3” job to run only after the other two jobs have finished running successfully. Since the other steps are now being run as part of the other two jobs, this job only needs to run the “Configure AWS credentials” and “Push to S3” steps.
Here’s what the steps list will look like when you’ve deleted the first three steps:
New deploy job
You need to check both Create Build and Run Tests under Dependencies since the deploy job depends on those two jobs running successfully. Here’s how the job’s details (and the pipeline) will look when you do that:
Job dependencies configured
Click the dropdown that says Ignore artifacts next to the Create Build checkbox under Dependencies and change its status to Use artifacts:
Artifact usage configured for the job
Scroll down to the Optimizations section, where you’ll see that the Reuse Job Results toggle is on by default:
Reuse job results toggle
Switch the toggle to off. Disabling this ensures that, regardless of whether the repository receives a new commit, each pipeline run updates the last successful build artifacts on the S3 bucket. This can help in situations where the contents of the S3 bucket have been manually modified and you need to restore them to the last successful build state.
Now, you can click the Save and run button and watch as the pipeline tests and builds your code before deploying it to S3.
You can watch as the various steps of the pipeline run in order to build, test, and deploy your React app:
Optimized pipeline run in progress
You can explore the execution logs of each of the jobs and their steps by clicking the job and then navigating through the logs in the right pane. Once the build completes running, here’s what the page will look like:
Successful test results of the optimized pipeline
You can now try pushing a new commit to your forked GitHub repo and watch the pipeline get triggered automatically. Within minutes, it will test, build, and deploy your updated React website to the S3 bucket!
Conclusion
This tutorial explained how to set up an automated deployment pipeline with TeamCity to deploy a React app from GitHub to an Amazon S3 bucket. This process eliminates manual intervention, ensuring your app is deployed faster, more reliably, and with consistent results.
Automating your React app deployment not only saves time but also minimizes errors and improves overall development workflows, allowing your team to focus on delivering value to users.
With tools like Build Approval, TeamCity allows you to add an extra layer of security by ensuring that only authorized builds are deployed to production. Meanwhile, as you saw in the tutorial, build chains (or pipelines) enable you to manage complex workflows by breaking them into smaller, interdependent tasks, making large projects easier to handle.
These features, combined with TeamCity’s comprehensive reporting and automation capabilities, make it a powerful choice for your deployment needs. Make sure to give TeamCity a try for your next React app project!
We’ve been busy improving TeamCity Pipelines to make your CI/CD workflows even smoother. Here’s a quick update on what’s new!
SSH authentication option
Exciting news – we’re expanding the list of authentication options in TeamCity Pipelines! Now, you can easily authenticate using SSH. Once you set up SSH keys, you can push and pull without entering credentials each time.
You can upload existing SSH keys or generate new ones in TeamCity Pipelines. We’ve also added an SSH keys management page where you can conveniently see and manage all existing keys.
Custom Git URL support
When you connect a VCS provider to your TeamCity Pipelines account, you can easily select the repository for which you want to create a new CI/CD pipeline.
Previously, we only supported GitHub, GitLab, and Bitbucket as VCS providers. Now, you can also build from just about any custom git repository.
Unsubscribe from failed pipeline notifications
TeamCity Pipelines notifies you every time a pipeline fails. But sometimes, you don’t really need to receive a notification each time a single pipeline fails.
Now, you can subscribe to and unsubscribe from notifications for a specific pipeline. To do so, simply click the Subscribe button in the pipeline interface.
New color scheme for Edit mode
Enjoy the updated purple color scheme for when you’re editing a pipeline.
Bug fixes and improvements
We fixed the issue with misplaced footers.
We improved the overall look of the Agents management page.
TeamCity Pipelines now clearly states in which format you should enter a custom version in the Maven build step.
The Pipeline Optimization block sometimes showed incorrect values for the time saved during optimization – we fixed that.
This article was brought to you by Mdu Sibisi, freelance writer, draft.dev.
Cloud technology has reshaped how developers manage and deliver software. For example, “serverless computing” allows a provider to dynamically manage the allocation and provisioning of servers for you, which makes it ideal for running microservices.
When paired with CI/CD practices, serverless computing can help shorten development cycles, reduce the incidence of errors, and increase the scalability of pipelines.
However, it does present some unique challenges, such as achieving comprehensive visibility, establishing secure and compliant interservice communication, and managing deployment and versioning. Many of these obstacles can be overcome using a tool like JetBrains TeamCity to integrate CI/CD with serverless computing.
This guide explores the best practices for microservice management through CI/CD integration on serverless computing and how TeamCity can simplify the process.
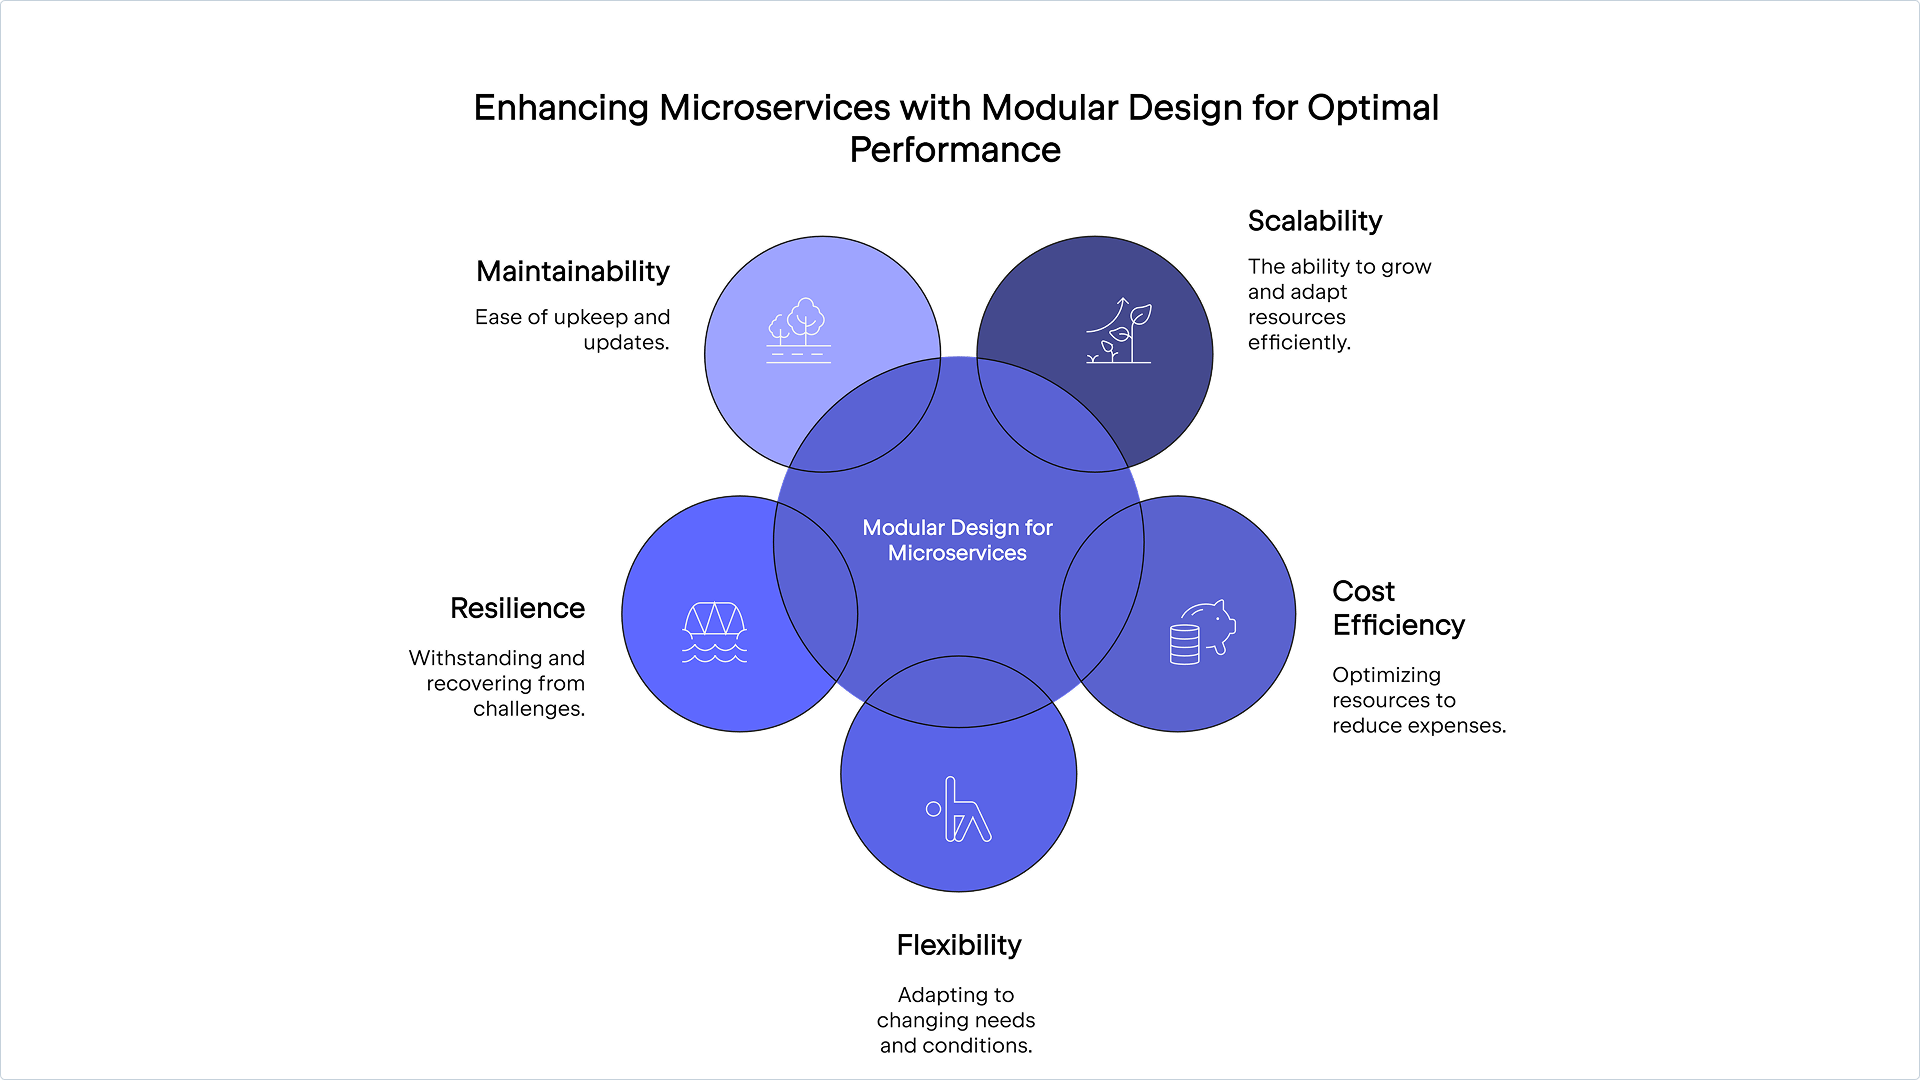
Modular design for microservices
When building microservices for serverless architecture, you should adopt a modular design to optimize compatibility with CI/CD pipelines. While alternatives like monolithic architecture, service-oriented architecture (SOA), and micro-frontend architecture each have their merits, they often introduce complexity and overhead. Modular design, on the other hand, allows you to create flexible, efficient microservices that align with serverless computing.
Modular design allows you to break an application down into smaller, independent components or microservices. A good example is how streaming services use dedicated modules or microservices for each major component, including user authentication, content management, recommendation systems, and billing.
This approach improves each component’s scalability, cost efficiency, flexibility, resilience, and maintainability.
Single responsibility principle (SRP)
Regardless of the use case, it’s crucial that your microservices align with the single responsibility principle (SRP), which states that each microservice should have a clearly defined purpose or responsibility that focuses on a specific business or usage function. This makes them easier to manage, debug, and troubleshoot.
High cohesion
To effectively implement SRP, microservices should be highly cohesive, with components closely related and working together. This improves maintainability, reduces complexity, and allows for focused testing, as each module can be tested in isolation.
Loose coupling
Loose coupling, or decoupling, means that alterations or changes in one microservice should not significantly affect another. It allows for independent development, deployment, and scaling of each service, which can often be challenges associated with running microservices on serverless architecture. Updates or changes to one module can be deployed without taking down the entire application, reducing downtime and improving availability.
Decoupling can make dependency mocking or stubbing simpler and enable you to thoroughly test each module’s functionality without relying on other services.
API-first design
To enhance cohesion and reduce coupling, adopt an API-first approach to microservice design. This involves creating a well-defined API before developing other components, which should provide consistent communication, smooth interoperability, and simplified integration. It also streamlines documentation and monitoring.
Automating builds and deployments
Automated pipelines make it easier to handle multiple microservices. You can use them to manage the build and deployment of multiple microservices simultaneously. These pipelines can also scale in response to increased demand, helping build and deployment processes remain efficient even as the number of microservices grows.
While you can write scripts and develop your own background services to manually build your pipelines, it would be far easier and more efficient to employ a tool like TeamCity, which provides a flexible, all-in-one solution to build, test, and automate deployment.
It offers multiple configuration options (most notably configuration as code) and templating. Alternatively, you can use one of TeamCity’s SaaS implementations for a web-based wizard that allows you to initialize and edit your pipelines visually.
TeamCity Pipelines interface
Version control and management
You also need a way to manage versions of serverless functions and microservices to maintain stability, backward compatibility, and smooth deployments. There are two main versioning strategies to consider:
Semantic versioning is used to indicate major, minor, and patch changes. It makes it easier to identify the impact of changes and manage dependencies.
API versioning allows you to manage changes in the API contract. You can use URL versioning (such as /v1/resource), header versioning, or query parameter versioning.
Each version of your serverless functions and microservices should be accompanied by clear and comprehensive documentation.
This must include API endpoints, request-response formats, and any changes introduced in each version. In addition, it’s important to keep a detailed changelog to track changes, bug fixes, and new features for each version. This helps developers understand the evolution of the service.
It’s good practice to ensure that your microservices are backward compatible. This helps prevent changes from breaking existing clients.
Despite your best efforts, things may still go wrong. So, establishing rollback mechanisms is important. They enable quick recovery from deployment failures by swiftly reverting to a stable version. Additionally, they give teams the confidence to experiment with new features or changes to their microservices while knowing they can easily revert if something goes wrong.
Testing strategies for serverless microservices
Testing serverless microservices can be extremely challenging due to their ephemeral nature, event-driven architecture, and distributed systems. These factors make it difficult to reproduce and debug errors, simulate events accurately, and test interactions between services.
Additionally, maintaining consistent performance, security, and compliance across multiple third-party services adds complexity. However, there are tailored strategies and tools you can adopt to help improve the quality and reliability of serverless microservices.
Unit testing
This type of granular testing focuses on assessing whether individual functions or components perform as expected in isolation. Available frameworks include Jest (JavaScript), pytest (Python), and JUnit (Java). Mocking and stubbing frameworks allow you to simulate external services and dependencies.
For instance, you can stub out external API calls and dependencies to control their behavior during testing. This helps in creating predictable and repeatable test scenarios. In addition, it’s important to write tests for all possible input scenarios.
Integration testing
Integration testing examines the interactions between different microservices and components to check that they work together correctly. Examples of available tools include Postman for API testing or integration testing frameworks like TestNG (Java) and pytest (Python).
Use integration testing to assess the communication between services, including API calls, message queues, and data stores. You can also use it to ensure data consistency and correct handling of edge cases.
End-to-end testing
End-to-end (E2E) testing involves validating the entire application workflow from start to finish to confirm that it meets business requirements. Available tools include Selenium, Cypress, and TestCafe.
You can use these tools to simulate real user scenarios and interactions, which can be crucial in making sure your serverless microservices function as they should. Fundamentally, E2E testing should be used to test the complete workflow, including authentication, data processing, and the user interface.
Simulate serverless environments
In addition to using the above approaches, it’s important to create staging environments that closely mirror your production environments. Once you establish your staging environment, deploy your serverless functions to it. You can further optimize and speed up testing by automating your staging environment integration tests.
Infrastructure as code (IaC)
IaC allows developers to define infrastructure configurations in code, which can be version-controlled and integrated into CI/CD workflows. This includes resources like serverless functions, databases, and networking components.
The typical workflow for using IaC for your infrastructure is as follows:
IaC implementation diagram
Code commit: Developers commit changes to the IaC configuration files in the version control system.
CI pipeline: The CI pipeline is triggered, running automated tests to validate the IaC code.
Approval: Once the tests pass, the changes are reviewed and approved.
CD pipeline: The CD pipeline is triggered, deploying the serverless infrastructure changes to the staging environment.
Testing: Automated tests are run in the staging environment to check that the changes work as expected.
Promotion: If the tests pass, the changes are promoted to the production environment.
Monitoring: The deployed infrastructure is monitored for performance and health, with automated alerts set up for any issues.
Manually integrating IaC with CI/CD pipelines can require significant effort and be time-consuming, especially for serverless infrastructure. This is another area where a tailored solution like TeamCity can help.
You can use it to automate builds and deployments to ensure consistent validation and packaging of IaC configurations. With support for AWS CloudFormation and Terraform, TeamCity automates resource and application deployments, enabling efficient and reliable serverless infrastructure management.
Implementing CI/CD for serverless applications comes with its own set of challenges. The following sections cover some key challenges and how they can be addressed.
Latency related to cold starts
Serverless functions can experience latency during cold starts, which happens when they are invoked after a period of idleness. This increased latency, caused by the cloud provider provisioning necessary resources, can affect the performance and responsiveness of serverless applications, particularly in CI/CD pipelines with rapid and frequent deployments.
Some strategies you can use to address these issues include:
Using provisioned concurrency: Pre-warm a set number of function instances so they are always ready to handle requests without delay.
Preparing event-driven warmups: Use scheduled events to periodically invoke functions, keeping them warm and reducing cold start latency.
Optimizing function code and dependencies: Simplify function code, minimize dependencies, and use lightweight frameworks to reduce initialization time. For instance, remove unnecessary libraries and optimize code for faster startup times.
Choosing an optimal language and runtime: Select programming languages and runtimes with faster cold start times. Languages like Python, Go, and Node.js typically have shorter cold start times compared to Java or .NET.
Increasing memory allocation: Allocating more memory to functions can reduce initialization time, as more resources are available for execution.
Implementing predictive pre-warming: You could implement schedulers that determine the optimal number of instances to pre-warm based on predicted demand. This helps maintain a balance between resource utilization and latency reduction.
Using pre-warmed containers: Containers can be pre-warmed and kept running, reducing the cold start latency compared to traditional serverless functions. You can use AWS Fargate, Azure Container Instances (ACI), and Kubernetes with serverless frameworks to integrate containers with serverless architecture.
These strategies can minimize the impact of cold starts in serverless applications, leading to better performance and responsiveness in your CI/CD pipelines.
Dependency management
Managing dependencies for each microservice can be complex, especially when different services require different versions of the same library. Dependency management tools like npm (Node.js), pip (Python), and Maven (Java) can be used to give each microservice its own isolated environment to avoid conflicts.
Serverless functions often have deployment package size limits, which can be exceeded by large dependencies, causing deployment failures. To avoid this, optimize dependencies by including only essential libraries. Tools like webpack and Rollup can bundle and minify code, effectively reducing package size.
Dependencies can also introduce security vulnerabilities if not properly managed and updated. It’s important to regularly scan dependencies for vulnerabilities using tools like Snyk or OWASP Dependency-Check. Keep dependencies updated and apply security patches promptly to mitigate potential threats.
Environmental parity is another challenge you’re likely to run into. Ensuring that dependencies are consistent across development, staging, and production environments can be difficult.
You can use IaC to define and manage environments consistently. You can also use containerization to create a consistent runtime environment.
Observability and monitoring
Logging and monitoring are critical components of serverless architectures. They provide visibility into the performance, health, and behavior of serverless applications, enabling developers to maintain reliability, security, and efficiency. However, there are some challenges associated with logging and monitoring in serverless architecture.
For instance, because serverless functions are continuously changing, it can be difficult for observability and logging tools to capture and retain logs and metrics. Centralized logging solutions like Amazon CloudWatch, Azure Monitor, and Google Cloud’s operations suite can aggregate logs and metrics from all functions.
Serverless applications often consist of numerous microservices and functions, making it challenging to track and correlate logs across different components. You can address these shortcomings by implementing distributed tracing tools like AWS X-Ray, Azure Application Insights, or Google Cloud Trace to trace requests across multiple services and functions.
As serverless applications can scale rapidly, they generate a large volume of logs and metrics that can be difficult to manage and analyze. As such, administrators must use scalable logging and monitoring solutions that can handle high volumes of data. Implement log retention policies and use log aggregation tools to manage and analyze logs efficiently.
You can use CI/CD to feed data to monitoring systems. However, this can be challenging, especially when dealing with multiple environments and stages. It’s best to automate the setup and configuration of logging and monitoring as part of the CI/CD pipeline. IaC supports consistent configuration across environments.
It can be daunting to get all these moving parts and configurations to work together smoothly. In such instances, it’s always a good idea to use a single unifying tool to handle your IaC, microservice, and CI/CD pipeline management.
How TeamCity supports CI/CD for serverless microservices
As we already mentioned, TeamCity is a powerful CI/CD tool that can significantly streamline the process of managing serverless applications. Let’s look at a few ways it can help.
Pipeline configuration made simple
TeamCity’s visual editor provides an intuitive, drag-and-drop interface for configuring CI/CD pipelines. Changes made in the visual editor are instantly reflected in the YAML editor and vice versa.
TeamCity Pipelines interface
Along with the visual editor’s smart suggestions, the open terminal allows for easier troubleshooting and debugging. You can import existing YAML files from their repositories to make creating your pipeline easier.
TeamCity also offers robust support for IaC tools and deployment triggers. It integrates with AWS CloudFormation, Terraform, and the Serverless Framework. In addition to this, TeamCity offers a large variety of build triggers, including version control system (VCS), schedule, and dependency triggers.
The basic YAML configuration for a VCS trigger in TeamCity typically follows this structure:
The vcs section defines the version control settings, including the repository URL and the branch to monitor. The steps section defines the build and deployment steps using Gradle. The triggers section defines a VCS trigger that initiates the build and deployment process whenever there is a commit to the main branch. Any changes committed to the main branch will automatically trigger the build and deployment process in TeamCity.
Testing and feedback integration
TeamCity offers support for a variety of testing frameworks. This includes common unit testing, integration testing, and E2E testing frameworks. TeamCity can run these tests in cloud-based environments, ensuring your serverless functions are tested in conditions that closely resemble production.
Additionally, TeamCity allows you to run tests in parallel, which can be especially useful for large projects with extensive test coverage. The platform’s real-time notifications inform you of your build or test status through channels like email, Slack, and webhooks.
Flexibility and scalability
TeamCity’s distributed build agents allow it to facilitate flexible and scalable infrastructure and workflows. For instance, you can configure elastic build agents that can be dynamically provisioned and de-provisioned based on workload. This allows the system to scale up to handle peak loads and scale down during off-peak times, optimizing resource usage and cost.
By using multiple build agents, the platform can make sure that the failure of a single agent does not disrupt the entire CI/CD pipeline. Other agents can take over the tasks, maintaining the continuity of the build process. TeamCity can automatically detect and recover from agent failures, restarting builds on available agents and minimizing downtime.
But how does a typical deployment look in TeamCity? What makes it any different than setting up or creating your own system?
Deploying a serverless microservice
Developing your application using microservices already requires a lot of cognitive overhead. Setting up a system to deploy it on serverless architecture shouldn’t be as energy-consuming.
TeamCity is relatively easy to set up. You can build, test, and deploy a serverless application using the following steps:
In TeamCity, create a new project for your serverless application.
Connect your project to a VCS to track your code changes.
Add build steps to compile your serverless application. For example, if you’re using the Serverless Framework, you might add a step to run serverless package.
Ensure that all dependencies are installed. For Node.js applications, you might add a step to run npm install.
Add build steps to run unit tests using your preferred testing framework (such as Jest, Mocha, or pytest).
Add steps to run integration tests to check that different components of your application work together correctly.
Add steps to run end-to-end tests to validate the entire application workflow.
Add build steps to deploy your serverless application. For example, if you’re using the Serverless Framework, you might add a step to run serverless deploy.
Configure environment variables required for deployment, such as AWS credentials or API keys.
Configure VCS triggers to automatically start the build and deployment process whenever changes are committed to the repository.
Monitor the build and deployment process in real time through the TeamCity interface.
Review detailed test reports to identify and fix any issues.
Check deployment logs to confirm the application was deployed successfully.
Emerging trends in CI/CD for serverless microservices
Advancements in CI/CD for serverless microservices are shaping the future of software development. Two of the key emerging trends in CI/CD are event-driven pipelines for automation and AI.
Event-driven CI/CD pipelines enhance the efficiency and responsiveness of the software development lifecycle. These pipelines react to specific events, such as code changes, feature requests, or system alerts.
For instance, triggers can come in the form of HTTP requests made to specific endpoints. In cases where an external system or service needs to initiate a build or deployment, it can send a request to the CI/CD pipeline’s API endpoint. TeamCity is well equipped to manage event-driven workflows, enhancing the automation and responsiveness of CI/CD pipelines.
AI is also revolutionizing CI/CD pipelines by introducing advanced optimization techniques that enhance efficiency, reliability, and speed. AI algorithms in predictive build optimization analyze historical build data to predict the likelihood of build failures. When used appropriately, it can improve overall resource utilization.
In addition to the above, AI can make software testing more robust and reliable. TeamCity can be integrated with AI-powered tools that can analyze code quality and suggest improvements. One example of such a tool is SonarQube, which can perform static code analysis and provide code improvement suggestions through its AI Code Fix tool.
Conclusion
Aligning CI/CD practices with serverless computing can help you optimize the microservice deployment. However, it does present some unique challenges, which can be overcome by following the best practices highlighted in the above guide. Tools like TeamCity make it far easier and more manageable to implement these strategies and practices.
The platform offers 14-day trials for its SaaS implementations and a 30-day trial for its On-Premises Enterprise edition. Once you’ve decided on an implementation, learn how to configure your serverless CI/CD pipeline using configuration as code through Terraform or learn how to integrate it with Kubernetes.
TeamCity is a flexible solution that makes configuring and managing CI/CD in serverless environments easier.